I wanted a way to display my energetic consumption on my wall, like on a weather station. I looked into different display solutions, and it turns out the nicest and easiest seems to be hacking a Kindle into displaying images refreshed periodically.
I therefore started making a graph generator that would take the data reported by my Linky electricity meter. The data is sent periodically to Enedis, which in turn offers a webpage which displays it - and makes it available through a private JSON API.
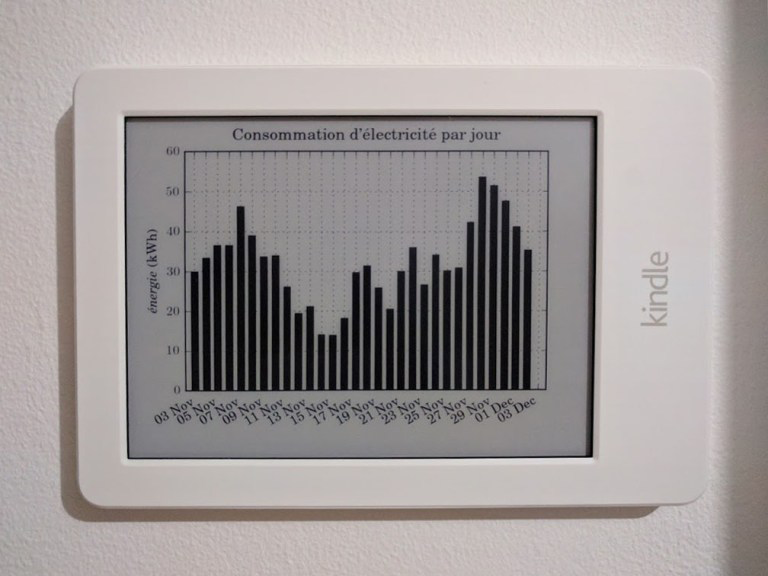
A few hours later, I had a Python script that could log into the Enedis website and download the meter's data. It can then be processed by the Python script, to generate PNG files of graphs that I will then display on the jailbroken Kindle.
Check the Github repository and this blog post (fr) for more info!
Check out the source code for Python 3